
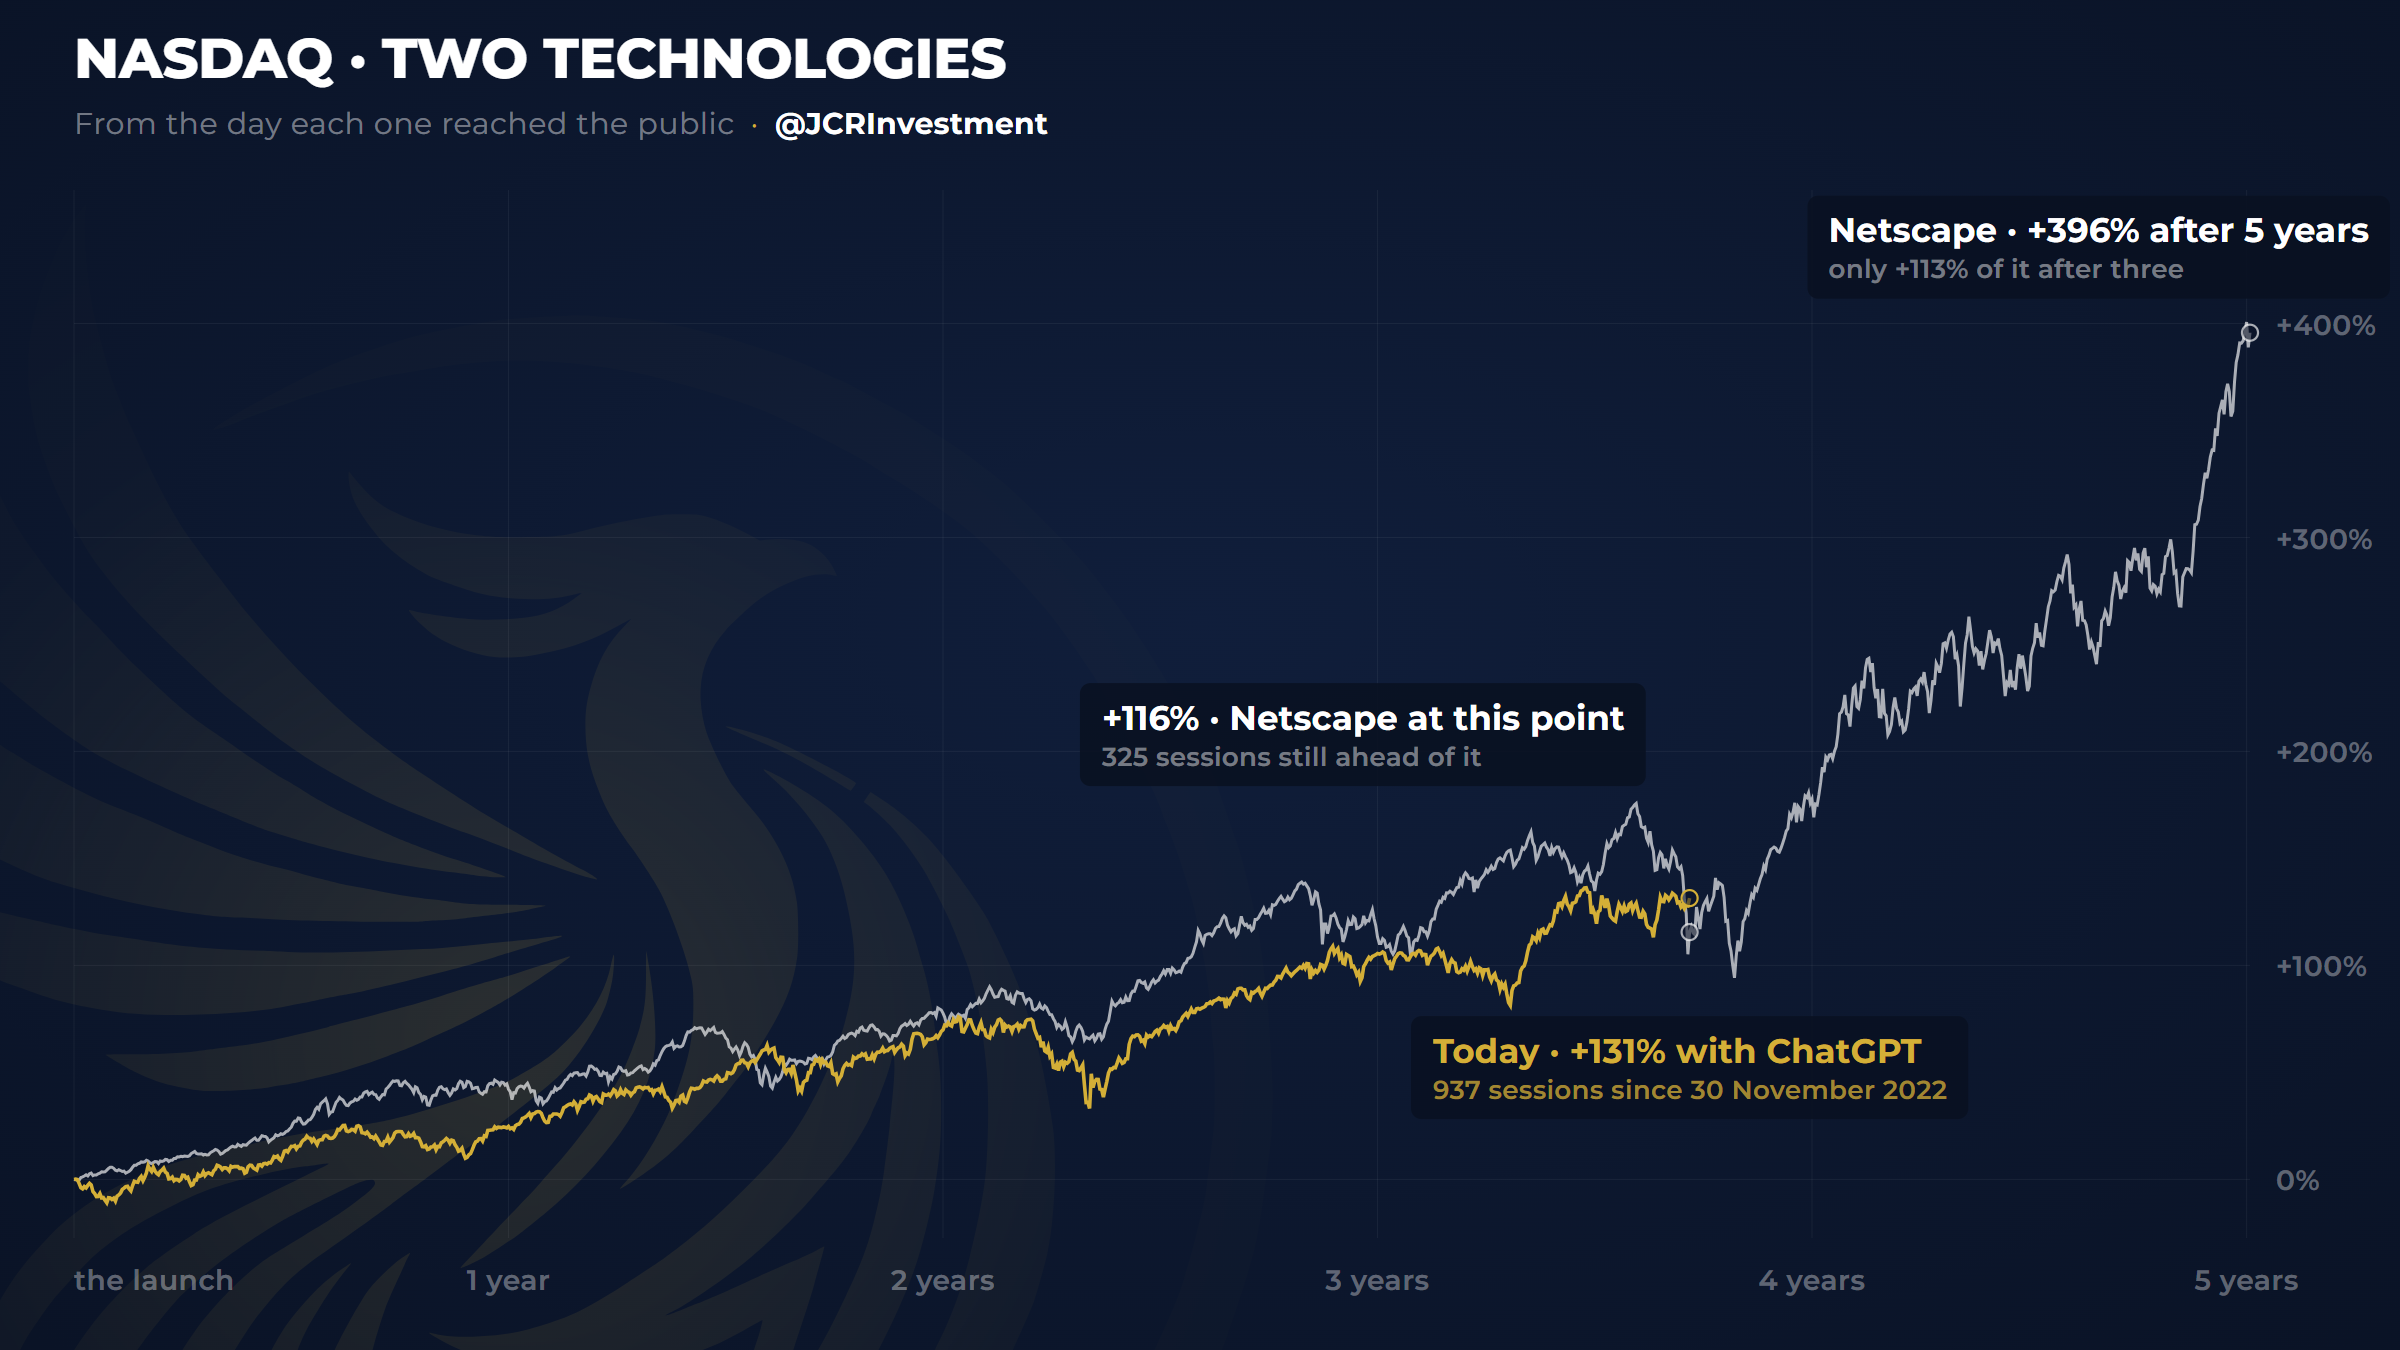
At this point, the internet still had its best ahead
This chart is a marvel, and not for what it shows but for what it implies behind it. It is not comparing two technologies and an index for the sake of comparing them.
It shows how capital follows the same playbook in front of a technology that can change the world, and how those moves create huge bubbles in the markets. Twenty-eight years apart, and the index is behaving exactly the same.
 From the newsletterI'm opening my portfolio with $40,000 and buying nothingRead now (opens in a new tab)
Share it with someone who needs to see this.