

How they're fooling you with BTC
I’ll get straight to the point. While everyone is selling you the idea that the worst is over for BTC and that we’re heading for new highs, the move it is actually making is one of the most dangerous there is for your portfolio and for any investor.
It is a classic move from the playbook of the strong hands that move the markets. It is designed to pull in as much money as possible through a powerfully bullish push and then, once they have everybody inside, to trigger a final capitulation in the asset.
The worst for BTC may still be ahead.
Let me quickly explain how they engineer this move and how it can affect your portfolio. By the time we’re done, it will serve you not only for BTC but for any asset in the markets.
What does this move in BTC really mean?
Everyone is telling you BTC is on its way to highs, so let’s look at what this move genuinely means.
 — expand to full screen
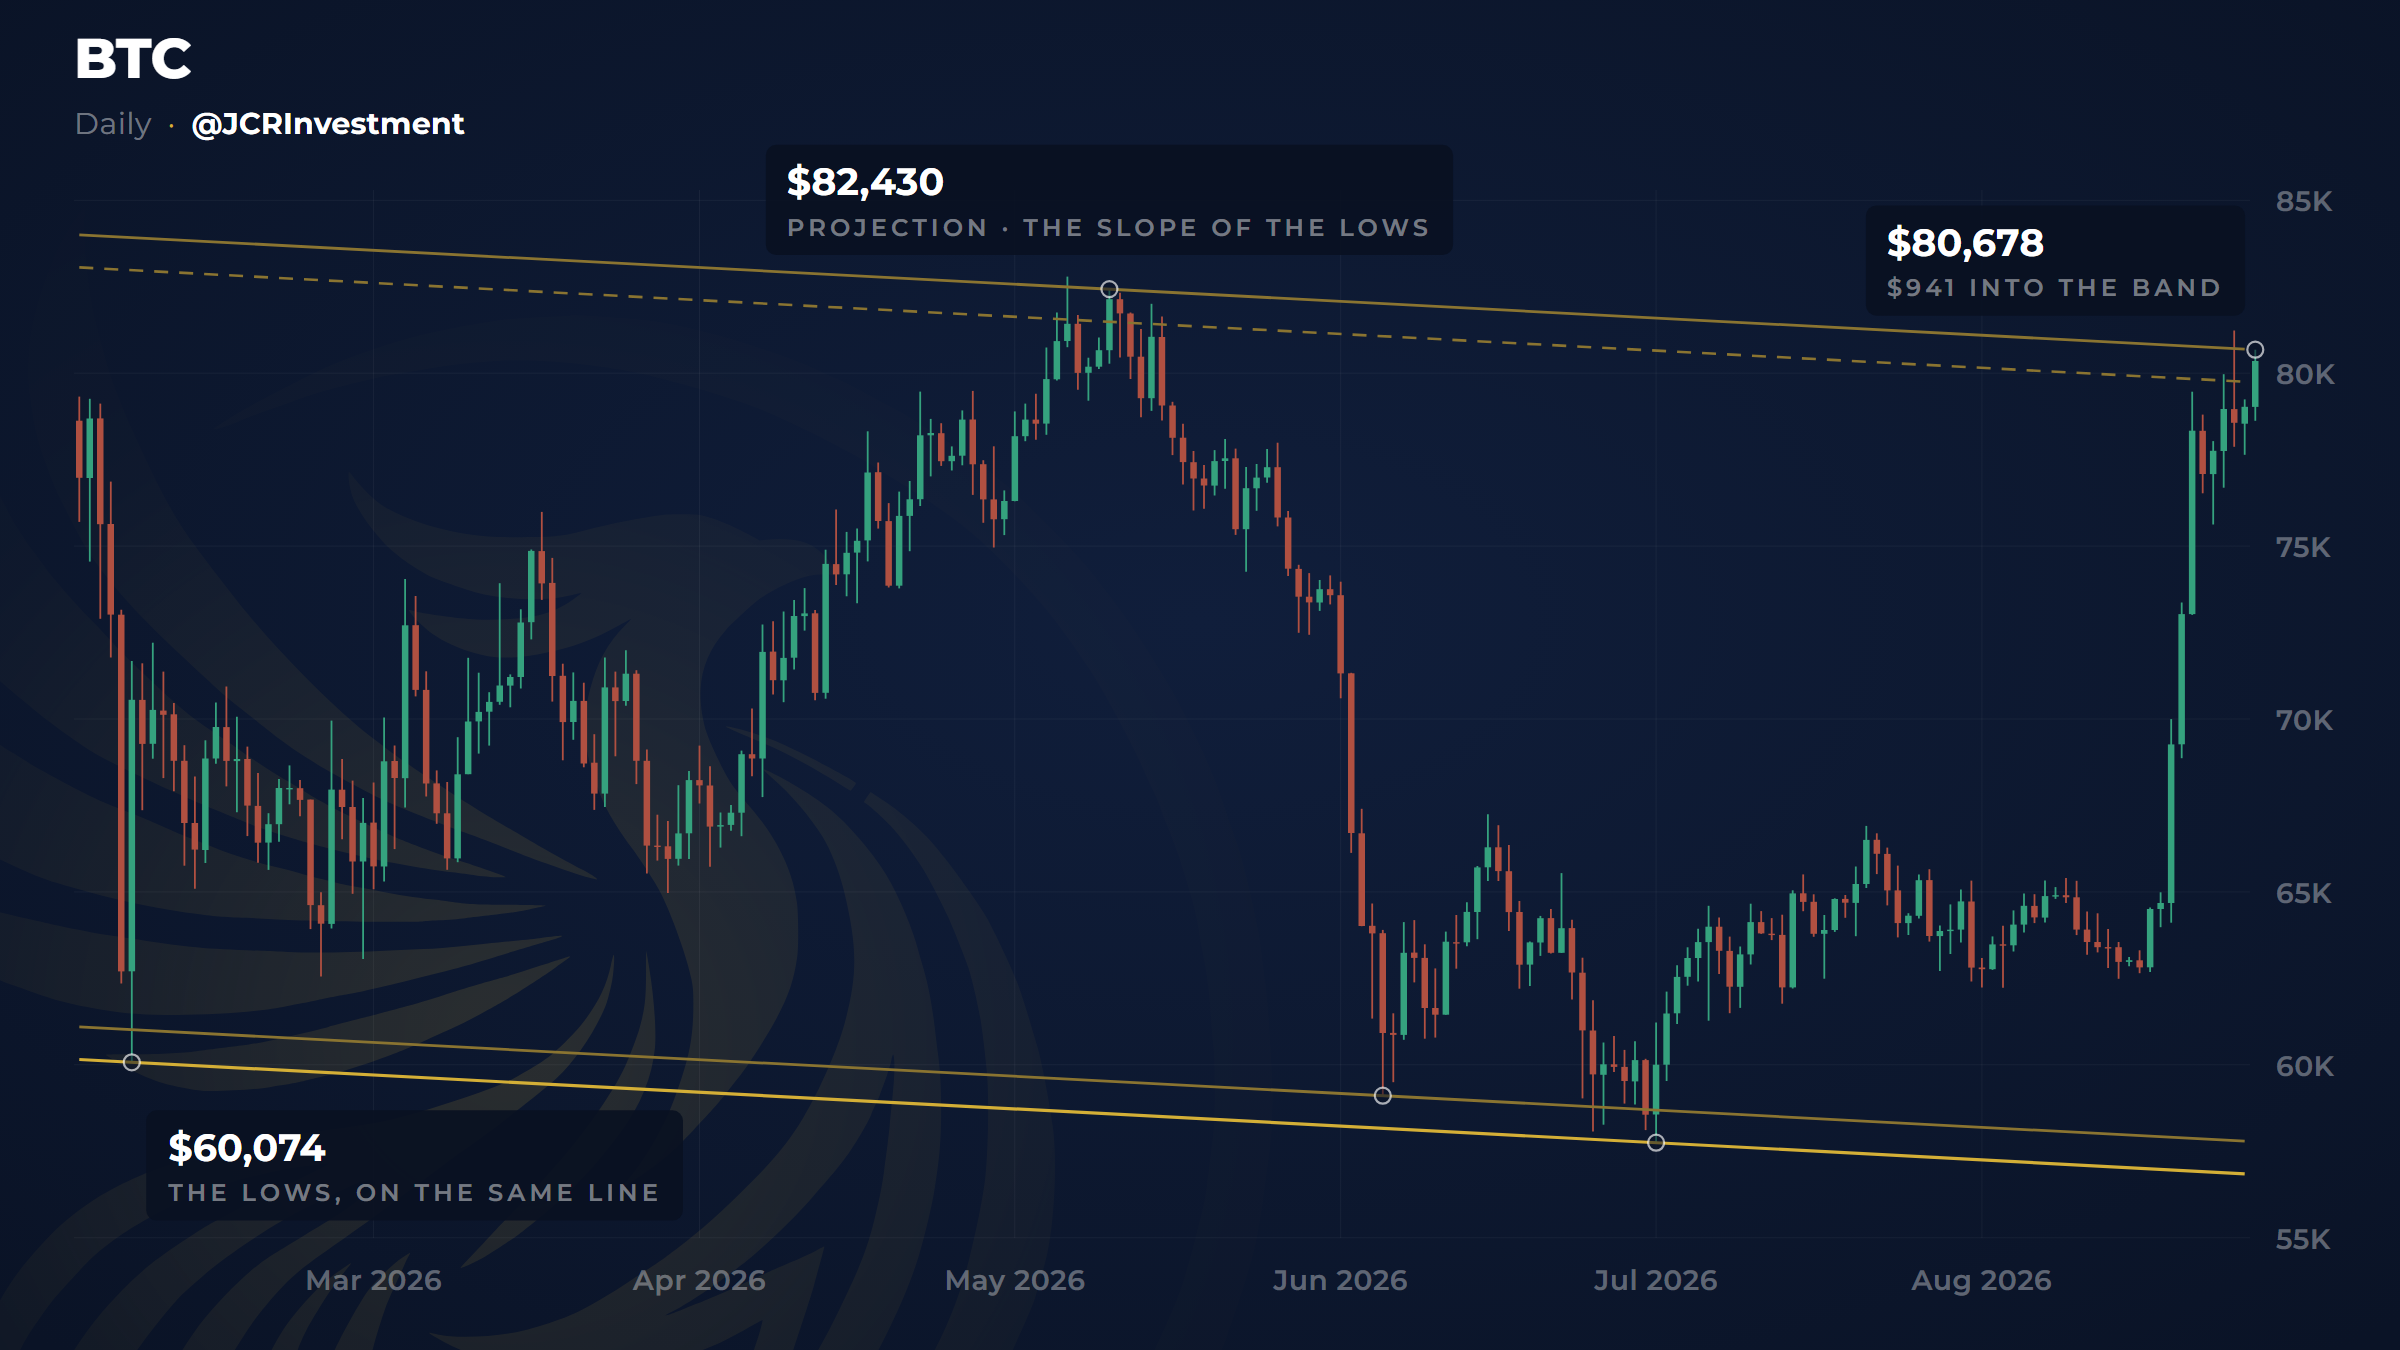
As you can see, it is still inside its short-term downtrend. As I write this article, it is leaving behind a candle known as a gravestone doji, hitting the ceiling of the channel head-on, telling you the bullish move is coming to an end.
While everyone turns tremendously bullish, the indicators are signalling that something is not right.
What else is flagging trouble?
Everyone has gone ultra-bullish on BTC. Look at how fast the mood has changed.
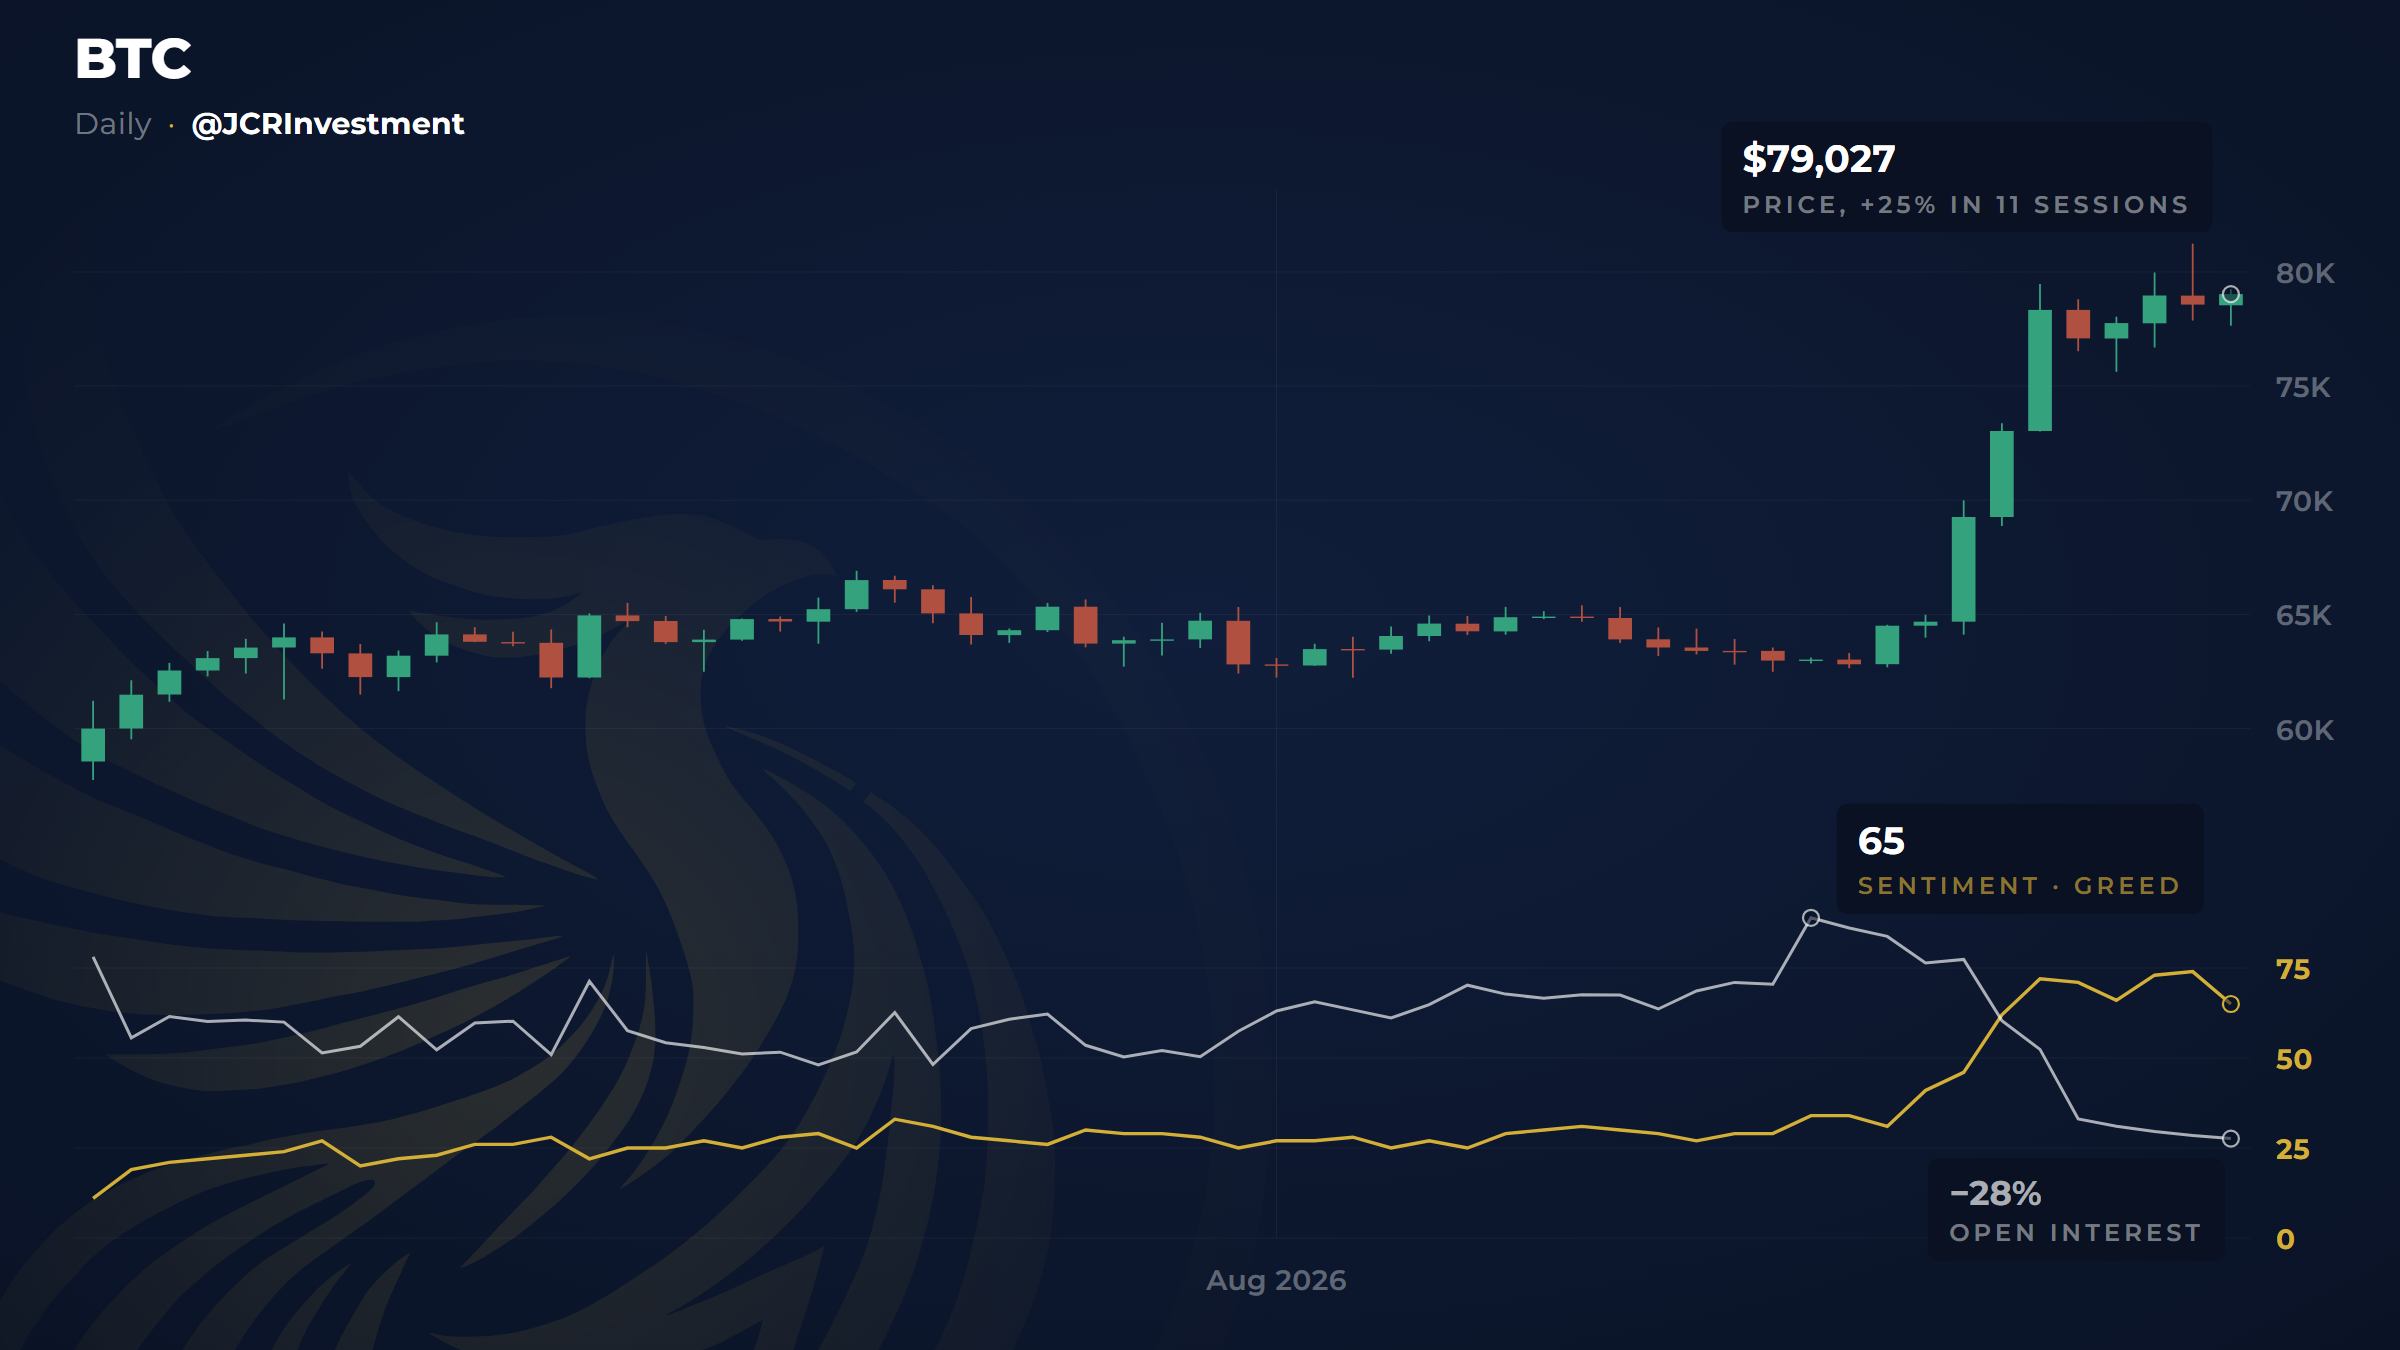
On 17 August, the index that measures fear and greed in bitcoin read 31: Fear.
Seven sessions later it read 65: Greed. A level like that hadn’t been seen since October last year. From frightened to in a hurry in a single week.
That’s as far as everyone else goes. Now for the part nobody tells you.
 — expand to full screen
The two lines at the bottom are the key. The golden one is people’s mood, spiking. The white one is the money: every bet currently live in bitcoin futures, for and against.
And it turns out that while the price rose 25% in eleven sessions, those bets fell 28% from their peak on 15 August. The two lines cross right at the end of the chart, and that crossing is the whole story.
That crossing happens for one reason only: while the great majority of retail investors rush to get in, the big hands are rushing to get out.
On top of that, this whole move arrives at a moment when the indices are facing a correction through year-end. I’m not going to repeat everything we’ve been discussing these past days, so here’s a short summary.
- There is a bubble in the semiconductor sector. It has been the leading sector of recent years and it is setting up for a fall. Indices like the KOSPI have already fallen 40%, but that is only the beginning.
- When the leaders of the indices fall, the index doesn’t feel it at first, because a rotation of assets takes place. When that rotation ends, the index feels all the consequences at once.
- We’re arriving at a bad seasonal moment for equities. October is known as the month of floors and, in midterm years, it is by far the worst of the whole year.
- Add to all this a war with Iran and an oil price that has been held down by artificially intervening in the markets — but that doesn’t last forever. Inventories are not filled with paper; they’re filled with barrels, and if those barrels don’t arrive, the price goes up whatever you do.
- And finally, the yen carry trade. One of the world’s money pipes, which I’ll explain in another article.
As you can see, the market is sending warning signals from every direction. There is calm on the surface, but under the bonnet there are serious problems.
Problems they are trying to solve with interventions in the yen, in oil and in bonds. Interventions that are like what happens at my house when a crack appears in the wall and I paint over it. Four days later it’s back, and bigger every time.
They are trying to hold the market up until the November midterms. They have two options: either they trigger a fall beforehand and arrive in November with the indices recovered, or they hold on until the very last second and the fall afterwards is far worse.
Now that you know the move in BTC and the state of the market around it, let’s get to the final part, the one that can serve you for the rest of your days investing in these markets.
The carrot and the stick
It is one of the oldest moves in the markets. Many of you think the market was created for you to make money. WRONG.
The market is designed to fool as many people as possible, as many times as possible.
This move BTC is making works like this:
- Everyone is positioned bearish. You inject an enormous push higher, creating what is known as a short squeeze. You clear every bear out of the market.
- Sentiment flips and when the world sees a 40% rise in a week, it shouts “back to highs”.
- Everyone piles in bullish, thinking the worst is over.
- Once everyone is positioned bullish on the asset, you run the same play in reverse. You inject a fall and a final capitulation, clear out every bull and leave the asset in a place where nobody wants anything to do with it because they’ve lost all hope.
- In that place you accumulate quietly, and that is where the real floor is made.
- Once they’ve accumulated enough, they blow the price higher and people start piling on, creating a new bullish push that lasts years.
As you can see, BTC is making this move right now, but it applies to any asset you’ll come across in the markets.
I also firmly believe this move will be accompanied by a fall in the Nasdaq and in semiconductor ETFs like the SOX over the coming months.
To finish, I’ll tell you what I plan to do myself — not as a recommendation for you to do the same, but because when I write these analyses I am the first to risk my own money on what I say.
My money where my words are.
The Final Decision
Given the current picture, I am not buying this move in BTC. I could be wrong, but I’ll have more chances to get in if this genuinely improves and the fall doesn’t happen.
Even so, the odds of a correction are high and, since I’m no fortune teller, I place myself on the side where the odds favour me — and right now that means waiting for a correction in the markets and in BTC so I can get in at a better price before year-end, between September and November 2026.
If things don’t get too much worse, it could be one of the best buying opportunities in years.
I hope this article has been useful, that you take away an idea you can use forever and, above all, that it helps you be prudent in the markets.
I’ll keep updating everything each week on my Substack, and you can watch these analyses turn into moves with real money in my public portfolio.
Good luck, investor.
If you want the next analysis, it’s here: research.jcrinvestment.com
The Decision
Independent research, real decisions and next steps to help you build wealth that keeps growing even as the world changes
This is how I work
- I publish all my work
in a completely independent way - I leave the whole process
in plain sight, wins and losses - I risk real money, my
money where my words are
J.C. Rodriguez